Zero-code LLM observability lands: OpenLIT, OTel, AgentOps
OpenLIT just shipped a Kubernetes Operator that turns on tracing, tokens, and costs for every LLM app without code changes. See how operators and OpenTelemetry make agent observability instant, safe, and vendor neutral.
The news: observability without touching your code
On October 10, 2025, OpenLIT released a Kubernetes Operator that enables end to end observability for Large Language Model applications and agents without code changes or container rebuilds. In minutes, platform teams can capture traces for every model call, agent step, and tool invocation, with token usage and cost per request visible in the same timeline. The OpenLIT Operator builds on OpenTelemetry, so it fits cleanly into collectors and backends your organization already trusts.
If you have been waiting for observability to keep pace with how fast your agent code moves, this is the moment. The idea is simple and powerful: instead of wiring an SDK into each service and waiting for redeploys, your platform layer injects instrumentation at runtime. It is like adding smart flight recorders to every plane on the tarmac, not just the ones lucky enough to be in a hangar today.
Why operators and sidecars are winning
Most teams began LLM monitoring by sprinkling SDK calls through their app. That is fine for prototypes. It does not scale when you have:
- Many services, languages, and frameworks
- Multiple model providers that change monthly
- Compliance requirements that forbid logging prompt content by default
- SRE and FinOps teams who need uniform signals and costs in one pipeline
Kubernetes operators and sidecars solve those scaling problems.
- Central policy. A cluster operator can enforce where traces go, which attributes are redacted, and how sampling works across all namespaces.
- No redeploys. Mutating webhooks and native sidecars attach at pod start, so you avoid risky rebuilds just to flip on tracing.
- Polyglot coverage. Auto instrumentation agents exist for Java, Python, Node.js, .NET, and Go. For Go, a sidecar agent or an eBPF style approach can observe without code changes.
- Vendor neutral. With OpenTelemetry, you can route the same data to Grafana, DataDog, New Relic, Jaeger, or a specialized LLM observability product.
This pattern is already standard for traditional microservices. The novelty is bringing GenAI and agent semantics into the same pipeline so you get spans not only for HTTP and database calls but also for prompts, tokens, tool use, and reasoning steps.
The OpenTelemetry turn in AgentOps and peers
A clear 2025 signal is how agent tooling vendors are standardizing on OpenTelemetry.
- AgentOps exports traces that follow emerging GenAI conventions, so agent work can be visualized in any OpenTelemetry compatible backend while still feeding purpose built dashboards.
- Langfuse now supports ingestion through OpenTelemetry, letting teams keep their existing collectors while adding LLM specific analytics like prompt linking, token accounting, and scoring.
- LangSmith added end to end OpenTelemetry support, so traces from LangChain and LangGraph apps can flow through standard collectors into LangSmith or elsewhere, side by side with conventional service telemetry.
- Cloud platforms increasingly ship hooks that emit agent spans and model metrics using OpenTelemetry naming.
Put simply, OpenTelemetry is becoming the rails for agent observability. The OpenLIT Operator shows how to bring those rails to every pod without changing application code. If you are deep in productionizing agents, this echoes trends we covered in articles like Vectara Agent API deep dive and watch and learn agents operations.
How zero code instrumentation works
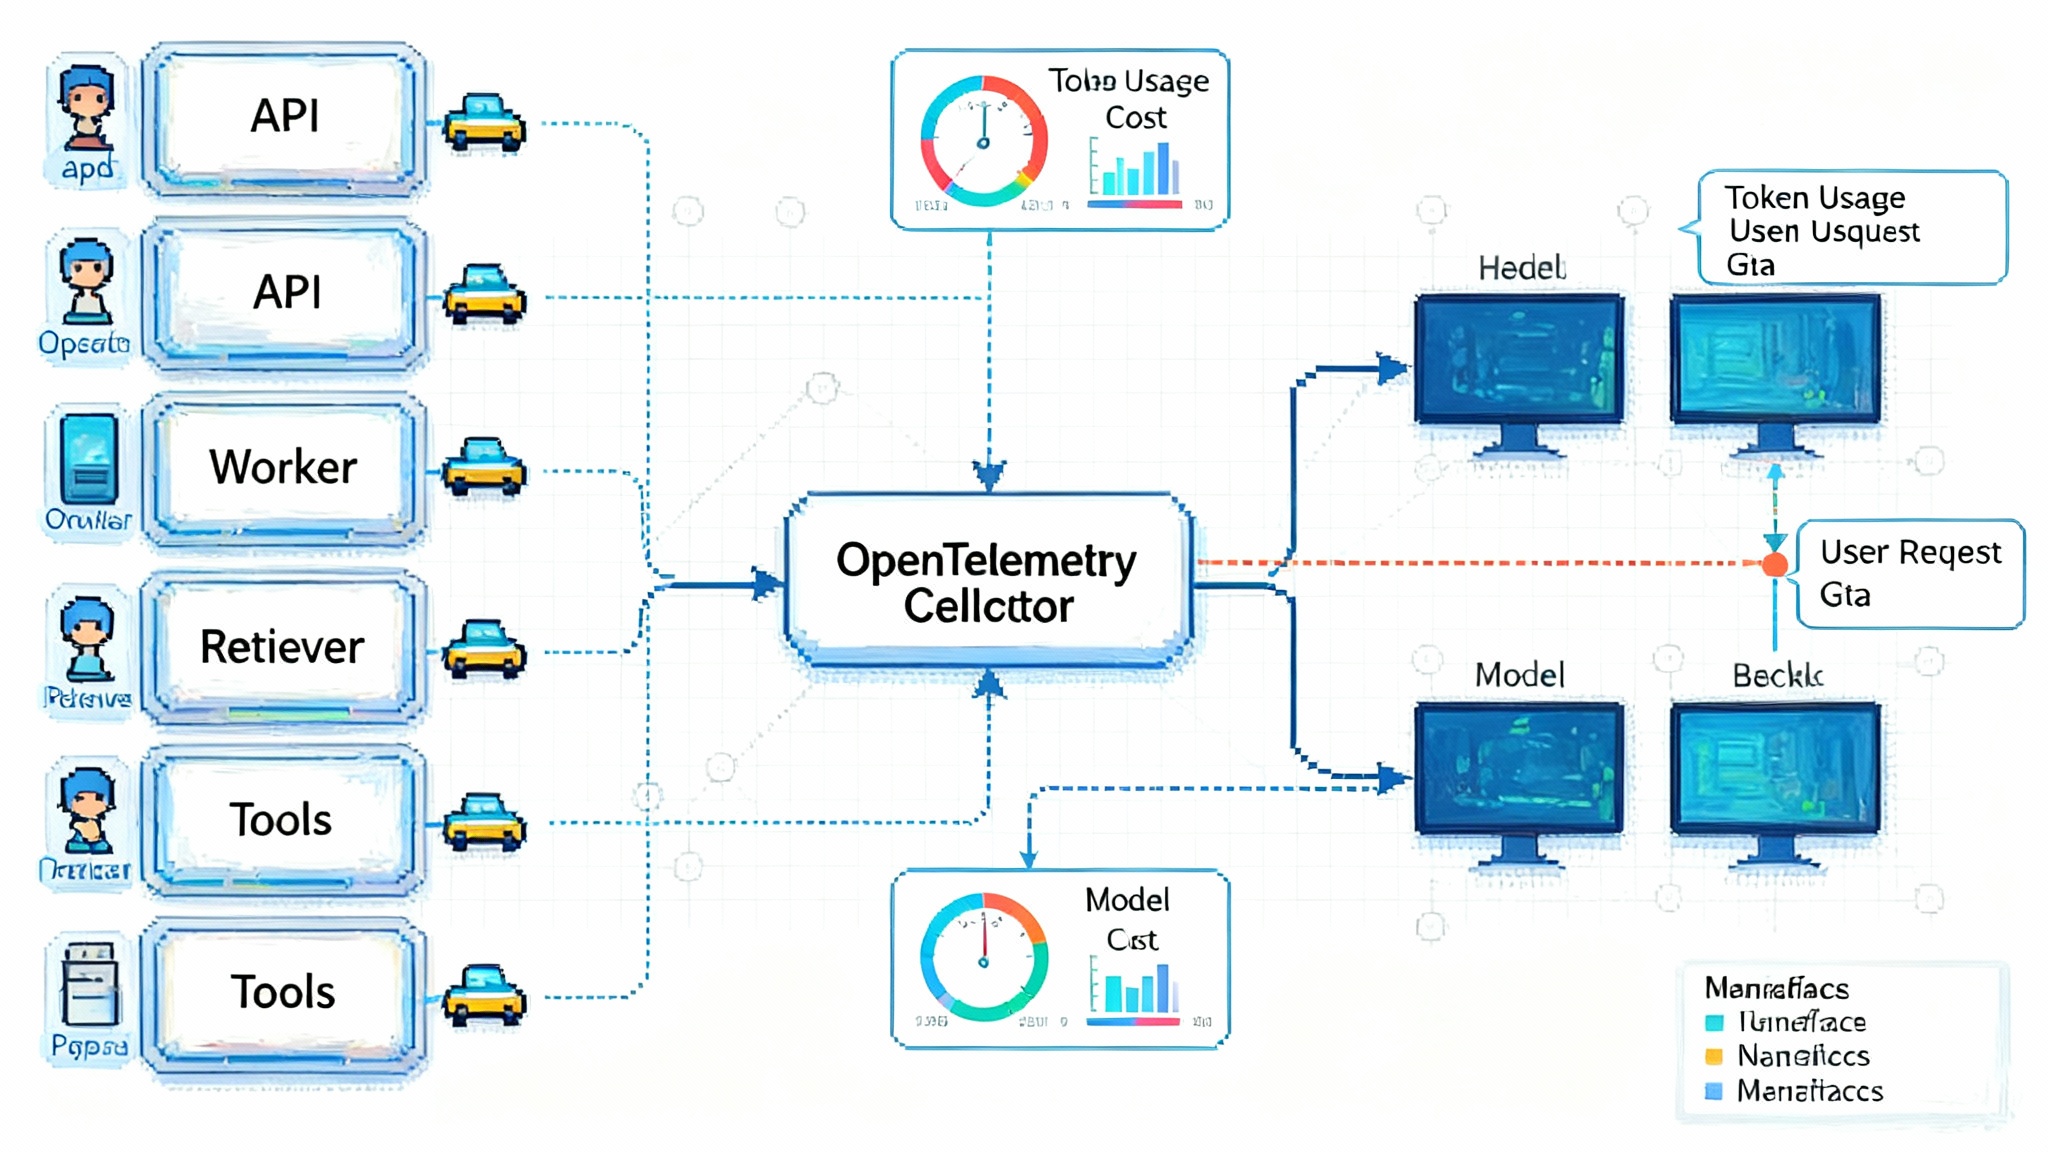
Under the hood, a zero code setup usually combines three pieces:
-
A Kubernetes operator with a mutating admission webhook. When a pod is created, the operator injects language specific instrumentation or a sidecar that captures traces and metrics. For languages like Java and Python, this resembles attaching a runtime agent. For Go, the operator can add a sidecar that monitors process activity. If you want the nuts and bolts, review the Kubernetes admission webhooks guide.
-
An OpenTelemetry Collector. The collector receives telemetry from your workloads, applies processors for redaction, sampling, and resource attributes, then exports to one or many backends. You can run collectors as sidecars for low latency, as DaemonSets for node level fan in, or as a central deployment for simplicity.
-
GenAI semantic conventions. To make LLM data useful, spans include attributes for model name, operation type, token counts, and cost. Tool calls and agent steps appear as child spans, so you can see the full causal chain from user request to tool execution and response. For naming and attributes, the OpenTelemetry project documentation is a helpful anchor.
Because the operator sets environment variables and injects agents at pod admission time, you can enable or disable instrumentation per namespace or deployment with annotations. That is a platform lever, not an application pull request.
What to track for production agents
If you only add one dashboard, make it a run level view that shows cost and latency alongside success, safety, and tooling behavior. Concretely, track:
- Token usage. Input and output tokens per request and per session. Watch for spikes that signal prompt regressions or context bloat.
- Cost. Billable tokens and currency per request, per tool call, and per user session. Budget by team, environment, and model family.
- Latency. Time to first token and end to end latency. Break out model latency versus tool time versus retrieval time. Inspect p50, p95, p99.
- Tool spans. Invocation count, failure rate, and retries for each tool. Flag tools that cause the most slowdowns or cost overruns.
- Agent loop behavior. Step count per task, backtracking patterns, and cyclic loops. Alert when step counts exceed a threshold for a task class.
- Safety and compliance events. Prompt injection detections, content policy flags, and redaction coverage. Track false positive and false negative rates.
- Fallbacks and vendor mix. Share of traffic per provider and model. Measure quality and cost deltas after automatic fallbacks.
- Retrieval quality signals. Document count and size per query, cache hit rate, and retrieval latency. Track drift in embedding versions.
- Errors. Provider errors, rate limits, invalid tool parameters, and timeouts. Classify by cause and show contribution to failed runs.
Tip: define these metrics per product surface, not only per service. Agents straddle services; your SLOs should map to user journeys. If you are exploring endpoint orchestration, you may also want to revisit our take on Post API agents across screens.
SDKs versus operators: when to use each
SDK first tools such as Langfuse and LangSmith shine in developer workflows. They often provide:
- Precise control. Developers can add custom events, scores, and structured inputs and outputs for evals and fine grained debugging.
- Rich domain models. Concepts like runs, generations, and datasets map to how practitioners reason about agents.
- Tight framework integration. Callbacks for LangChain, LangGraph, and Vercel’s AI SDK make local iteration fast.
Operator first setups deliver platform advantages:
- Instant coverage. Turn on tracing for every service in a namespace without touching code.
- Uniform policy. One place to enforce redaction, sampling, and export rules for all teams and languages.
- Lower deployment risk. No new app dependencies to vet and ship, which matters in regulated environments.
In practice, mature teams combine them. Use the operator to guarantee a baseline of OpenTelemetry spans everywhere. Layer an SDK where you want custom annotations, human feedback scores, or eval hooks. Because everything rides on OpenTelemetry, the traces can flow to both a general observability backend and a specialized LLM dashboard without duplication.
The hard parts and how to solve them
- Prompt and output content. Do not record full text by default. Configure attribute processors in your collector to hash or truncate prompts and completions. Allow encrypted sampling in pre production for debugging, then disable before going to production.
- Token accounting accuracy. Models differ in how they report usage. Prefer provider reported usage when available. If you must count offline, pin the tokenizer version and include it as a resource attribute so cost math remains explainable.
- Streaming traces. For server sent events and WebSockets, emit interim events for time to first token and chunk counts, not just a final close event.
- Cross service context. Ensure all services use the same trace context propagation. Confirm that your gateways preserve headers and that background jobs resume context when handling queued work.
- Sampling strategy. For production, use tail based sampling keyed on high cost or error spans so you keep the 1 percent of traces that matter. For pre prod, consider head based 100 percent sampling behind a feature flag.
- PII redaction. Maintain a deny list and an allow list of attributes at resource level to support cost allocation, budgets, and access controls. Default to redact, then allowlist what you truly need for debugging and SLOs.
- Multi tenancy. Add namespace, team, and environment attributes at resource level to support cost allocation, budgets, and access controls.
A four week rollout plan
Week 1
- Stand up a staging cluster with an OpenTelemetry Collector and the OpenLIT Operator.
- Enable auto instrumentation for one service per language you run. Verify traces show model spans, tool spans, tokens, and costs.
- Configure redaction processors to mask prompts and outputs by default.
Week 2
- Define run level and session level SLOs: p95 end to end latency, cost per successful task, and tool failure rate.
- Turn on alerts: sudden cost per request jump, step count over threshold, or tool error rate spike.
- Validate fallbacks by simulating model timeouts and checking that traces show fallback routes and cost deltas.
Week 3
- Expand to a full namespace. Enable tail based sampling that keeps all error traces, traces over a token threshold, and a random 5 percent of the rest.
- Add a budget dashboard by team and environment. Include month to date, forecast, and top cost drivers by tool and model.
Week 4
- Integrate evals where you need them. Keep the operator baseline, and add SDK level scoring only to the workflows that use human feedback or LLM as judge.
- Add a change management guardrail: block promotion of a new prompt or tool version if it increases p95 latency or cost per task by more than a set budget without an exception ticket.
How incident response changes
Before: An agent fails intermittently. You grep logs, try to reproduce locally, and hope someone remembers which prompt changed.
After: You open the run trace, jump to the tool span with the highest contribution to latency, see that input token count jumped after a retrieval change, and correlate that with a new embedding version. You know the fix and its cost impact before you post the incident update.
A sample drill
- Open the trace and filter to the relevant user session.
- Sort child spans by cost contribution and latency.
- Inspect the agent steps around the regression window.
- Confirm whether a tool or a model change caused the shift.
- Roll forward with a prompt trim or a provider fallback, then verify cost per task returns to baseline.
Frequently asked questions
Is zero code really zero?
For many services, yes. Java, Python, and Node.js often work with auto instrumentation agents and environment variables injected at pod admission. Go may require a sidecar or a small bootstrap shim, but you still avoid app rebuilds for configuration changes.
Will this lock us into a vendor?
Not if you keep your traces and metrics in OpenTelemetry. You can export to multiple backends in parallel for transition periods, or use a general observability system alongside an LLM specific dashboard.
What about privacy and compliance?
Keep prompts and outputs redacted by default. Use attribute processors for hashing and truncation. Store full content only in pre production with strict retention and access controls. Tag all resources with team and environment, and control routing at the collector.
How does this help experimentation?
Operators turn every deployment into an A or B ready environment. You can flip sampling, add attributes, or route traces for a subset of pods without touching application code. That accelerates evaluation loops and enables safer trials of new models or tools.
Why this becomes table stakes by 2026
- Agent complexity demands it. Multi step, tool using agents are no longer deterministic request handlers. Without causal traces and token aware costs, you are guessing.
- Platform ownership has shifted left. Security and compliance teams need redaction and retention controls at the cluster boundary, not in application code.
- Open standards have matured. With widely adopted GenAI semantic conventions, OpenTelemetry now describes the things LLM engineers care about. That removes the biggest blocker to standardization.
- Backends are converging. General observability vendors and LLM specific platforms all ingest OpenTelemetry. This reduces lock in and makes a baseline operator a safe default.
- Finance pressure is real. Budgets now ask for cost per task and cost per user. You cannot answer those questions without a token and span aware pipeline.
By 2026, if you are running production agents without OpenTelemetry native, instrumentationless monitoring, you will be the exception. Customers will expect reliable, cost aware agents, and auditors will expect traceable decisions and retained evidence.
A buyer’s checklist
- OpenTelemetry first. Prefer tools that emit and ingest standard GenAI spans and metrics.
- Zero code path. Look for Kubernetes operator or sidecar support that does not require redeploying applications.
- Redaction and governance. Ensure you can mask prompt and output content at the collector. Confirm retention defaults and data residency options.
- Token and cost fidelity. Verify whether the product uses provider reported usage and how it computes billable cost.
- Sampling and policies. You should be able to sample by cost, error, or step count and route hot traces to higher retention stores.
- SDK optionality. You want the option to add SDK level evals and custom events without breaking the operator baseline.
The bottom line
OpenLIT’s Operator is strong evidence that LLM and agent observability belongs in your platform, not scattered across application code. Pair an operator baseline with selective SDK instrumentation and you get the best of both worlds: instant coverage and deep insight where it matters. That combination shortens incident response, keeps costs predictable, and builds the trust you need to ship agents into real production.
The industry spent 2023 and 2024 inventing agent frameworks. In 2025 it began standardizing on OpenTelemetry. The teams that win in 2026 will turn those standards into guardrails that ship with every deploy.