Zero Instrumentation AgentOps: Groundcover’s eBPF Breakthrough
Groundcover launched zero instrumentation observability for LLM agents on August 19, 2025. By using eBPF inside your VPC, teams capture prompts, costs, and latency with no SDKs, no sidecars, and no data egress.
Breaking: the missing Ops layer for agents is finally here
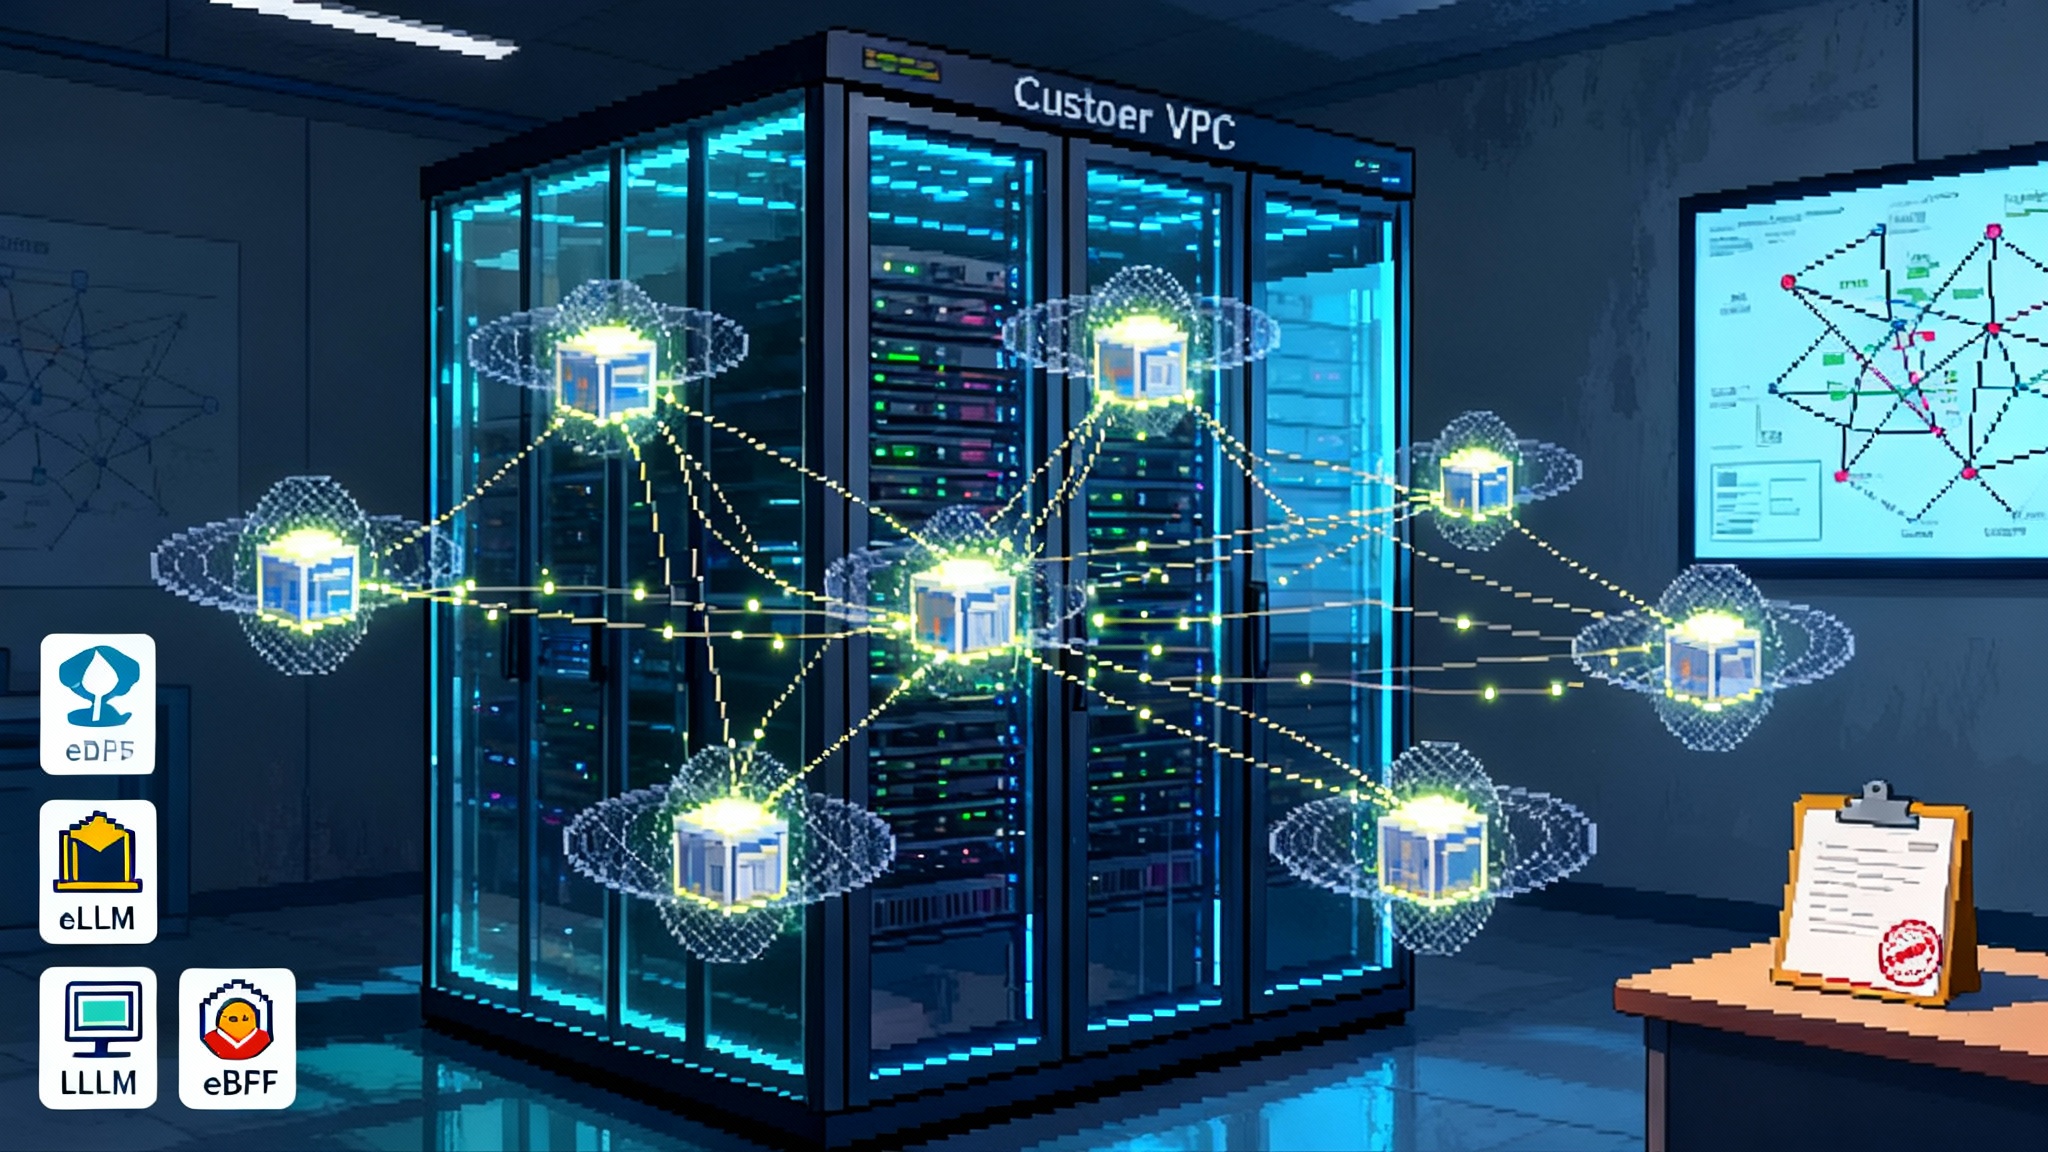
On August 19, 2025, Groundcover introduced a zero instrumentation observability product for large language model applications and multi agent systems. The company claims it can capture prompts, completions, token usage, latency, errors, and even reasoning paths by using extended Berkeley Packet Filter inside the customer’s own cloud. No software development kits, no middleware, and no data leaving the virtual private cloud. For teams stuck between unreliable pilots and risky production rollouts, this is the shift many have been waiting for. See Groundcover’s claims in its press release: Groundcover unveils zero instrumentation.
The timing matters. Agentic systems are moving from experiments to line of business workloads in customer support, developer tooling, document review, and decision support. As we have reported when agentic AI moves to daily ops, the operational needs are no longer nice to have. Teams want to know what broke, who did what, and how much it cost.
This article argues that eBPF based, in VPC telemetry is the missing operations layer for agents. It compares zero instrumentation with SDK based observability, breaks down architecture tradeoffs for retrieval augmented generation and multi agent workflows, and finishes with a practical AgentOps playbook for regulated teams.
Why SDK first observability stalls at scale
Most observability for LLM applications asks teams to adopt a software development kit or a tracing wrapper. It can work well in development. You add a decorator to the call that hits your model provider. You record token counts, latencies, and a correlation identifier. You add more decorators to tools, retrieval calls, and custom reasoning loops. Then you ship.
Production is where the wheels wobble.
- Coverage gaps: You miss calls that live outside the happy path. The legacy script that shells out to curl, the batch job that uses a different client, or the partner service that sits behind a proxy. If one link forgets to import the SDK, your trace is blind.
- Version drift: The application team updates a client. The wrapper lags. A new parameter or response field appears. Your dashboard breaks, and your on call engineer ends up debugging your observability stack instead of the incident.
- Overhead and fragility: Wrapping every call adds code paths and failure modes. With long running agents, even small overheads compound into real money.
- Data governance stress: Keeping prompts and completions inside your VPC is hard if your telemetry pipeline ships raw payloads to a vendor. Redaction looks helpful but becomes yet another risk to manage.
None of this is new. Traditional APM fought the same battle, which is why automatic instrumentation became a mantra. Agents reintroduce the problem with a twist. The system is dynamic, often self modifying, and spreads across processes and hosts. You need visibility that stands outside the code.
eBPF, explained plainly
Extended Berkeley Packet Filter is a Linux feature that lets you run tiny, safe programs in the kernel. Think of it as a security checkpoint at the boundary of your system that can inspect every bag without opening it and with minimal delay. It can observe network connections, system calls, process lifecycles, and application protocols. Networking and security teams have leaned on eBPF for years; observability vendors have used it to collect traces and metrics without injecting code into applications.
For agentic systems, eBPF’s superpower is its vantage point. It sits at the boundary between your application and the world. When an agent calls an external model provider over Transport Layer Security, the kernel still sees a socket, a destination, and a stream of bytes. With the right attach points and parsers, an eBPF based sensor can extract request and response metadata, measure latency, correlate the call to a process and container, and do so uniformly across languages and frameworks.
Research momentum is real. A useful framing appears in the AgentSight boundary tracing paper, which explores how to correlate high level intent with low level boundary events while keeping overhead low.
The operational effect is simple. You do not change your code to gain visibility. You do not add sidecars. You do not hope every team remembers to import a wrapper. You deploy a sensor once per node inside your VPC and get a consistent view.
Zero instrumentation versus SDKs
Here is a decision lens teams can use today.
-
Speed to coverage
- Zero instrumentation: Deploy a sensor across your nodes and immediately see calls to OpenAI, Anthropic, vector databases, embedding services, and utility tools such as search or storage. Legacy scripts and new services are both covered.
- SDKs: Coverage depends on developer adoption. Every language and client needs attention. New services require a pull request and a review cycle.
-
Fidelity of signals
- Zero instrumentation: Strong on timing, process context, network destination, and provider level metadata. With approved configuration, can capture prompts and completions. Unified view across services and languages.
- SDKs: Strong on application context such as user identifiers, business object identifiers, and custom attributes. Deep semantic logging is easy when you own the call site.
-
Risk and governance
- Zero instrumentation: Data remains in the customer VPC. Policies can restrict what content is captured or redacted before storage. There is no default data egress to a vendor.
- SDKs: Many hosted tools export full payloads. Redaction increases complexity. Vendor lock in risk is higher because code depends on vendor specific types.
-
Performance and cost
- Zero instrumentation: Kernel based capture minimizes application overhead. One sensor per node consolidates sampling, compression, and aggregation. Costs scale with nodes rather than code paths.
- SDKs: Each call site adds allocations and serialization. Under high traffic or long sessions, the overhead is real. You also pay in developer time.
-
Failure modes
- Zero instrumentation: Fewer moving parts in the app. Sensor failures are isolated to the node and are easier to roll back.
- SDKs: A library bug can take down production or silently drop telemetry.
The best answer for many teams will be hybrid. Use zero instrumentation to guarantee coverage and base reliability signals. Add lightweight application hints where business context truly matters. The point is to invert the default and make visibility the baseline without asking developers to rewire their code.
What changes for RAG pipelines
Retrieval augmented generation is not one call. It is a chain: embed, index, search, rank, prompt, respond. Failures and costs hide in the middle. Here is what an eBPF driven view inside your VPC buys you.
- Hotspot detection between steps: You can see when a burst of queries triggers an explosion of vector database calls. If your ranker is slow or your embedding service saturates, network telemetry and process level metrics make it obvious.
- Token budget governance: By watching outbound calls to model providers and reading token metadata where available, you can enforce budget policies. For example, flag prompts that exceed expected context windows or detect accidental recursive retrieval.
- Payload audit trails without egress: For regulated workloads you need to know which documents informed an answer. Zero instrumentation can log the identifiers of retrieved chunks and the exact prompts and responses when allowed by policy. Storage stays inside your cloud boundary, which simplifies risk reviews.
- Caching effectiveness: With consistent latency and byte level counters across calls, you can quantify the hit rate and savings from prompt and embedding caches. You do not need to guess whether that new cache layer pays for itself.
Concretely, imagine a customer support RAG that enriches tickets, retrieves account policies, and drafts replies. In production you begin to see a new error pattern. Outbound calls to your vector store spike while model calls shrink. The boundary view shows that your retriever raised top k from 8 to 64 in a recent deploy, which multiplied query fan out and pushed the system into tail latency. You roll back, then set an alert that watches byte counts and latency percentiles on the retriever path. No code changes were needed to observe or fix the issue.
For teams exploring memory centric architectures, we have seen how memory as the new control point changes RAG economics. Boundary metrics make those changes measurable, not speculative.
What changes for multi agent workflows
Multi agent systems coordinate planners, critics, tool users, and executors. They also involve humans in the loop. Observability must answer three questions: who decided what, who did what, and how long it took.
Zero instrumentation helps across process boundaries. Because the sensor is anchored in the kernel, it does not care whether a planner runs in Python, a critic runs in Node, and a tool caller runs in Go. You get:
- Session stitching by boundary events: When the planner triggers a search tool, you see an outbound call to a search API, then an inbound response, then a call to the model provider. By correlating process identifiers, sockets, and timestamps, you can reconstruct the critical path even when code level traces are missing.
- Loop detection and backoff governance: If an agent loops between critique and revise states, the pattern shows up as repeated calls to the same provider with similar sizes and timings. You can alert on these loops before they drain budgets.
- Human approval trails: When a human approves a step in a review tool, the resulting outbound calls and process events create an auditable sequence with timing and scope. That is often enough to satisfy internal audit without shipping sensitive content out of the VPC.
As autonomous agents shift from demo to delivery, platforms like Replit Agent 3 goes autonomous illustrate the speed of change. A boundary first view keeps pace even when frameworks evolve weekly.
Reliability, auditability, and cost control by default
Adopting eBPF based, in VPC observability flips three switches that have held teams back.
- Reliability becomes measurable: You can define golden signals for agents that match how they fail in the real world. Examples include tool availability, token budget variance, retrieval fan out, and reasoning step duration. These are not generic CPU graphs. They are operationally relevant signals from the boundaries where agents do their work.
- Audit becomes routine: By keeping telemetry inside your cloud, you can record prompts, responses, tool invocations, and document identifiers with retention policies and access controls that match your standards. Legal and compliance teams get the trails they ask for without new data transfer agreements.
- Cost becomes governed: You can attach cost models to outbound calls and token usage, then alert on deviations. For example, warn when a model upgrade increases average cost per request beyond a threshold, or when a new tool introduces excessive retries. These controls do not rely on developers remembering to log cost data. They are enforced at the boundary.
The AgentOps playbook for regulated teams
If you are moving from pilot to production in a regulated environment, use this playbook. It assumes you want to minimize code change and data egress while gaining the signals needed for safety and scale.
-
Establish in VPC observability as a prerequisite
- Policy: Telemetry for prompts, responses, tool calls, and retrieval identifiers must be stored and processed within your cloud account. No vendor retains payloads by default.
- Implementation: Deploy a node level eBPF sensor across your application clusters. Validate that you see outbound calls to model providers, vector databases, and critical tools.
-
Define agent specific golden signals and budgets
- For each agent workflow, document target latency, allowable token variance, tool error budgets, and retrieval fan out limits. Treat these as service level objectives.
- Build alerts on boundary metrics rather than only on application logs. Examples include outbound request rate to model endpoints, average tokens per completion, and tool error codes.
-
Create minimal context propagation, not full instrumentation
- Add a request identifier and a tenant or user identifier at the edge, then ensure it flows through headers where feasible. This lets you join eBPF boundary events with business context without wrapping every call site.
- For steps that truly need deep semantic logging, add targeted SDK hooks behind feature flags. Keep the surface area small.
-
Lock down payload capture with explicit allow lists
- Decide which prompts and responses can be captured in full and which should be redacted or summarized. Apply these rules centrally in the eBPF pipeline. Document them in your data map and secure sign off from legal and security.
-
Build default dashboards per pattern
- Retrieval augmented generation: show vector database latency and byte counts, hit rates of caches, model call token distributions, and error codes from external tools.
- Multi agent: show step duration distributions, loop detection metrics, tool availability, and human in the loop approval timelines.
-
Put agents on the on call rotation
- Define clear escalation paths and runbooks. For example, if loop detection fires, disable self critique, switch to a fallback prompt, and notify the owning team.
- Practice with game days. Simulate a provider outage, a vector store slowdown, and a runaway cost scenario. Prove that your boundary alerts fire and that mitigation is quick.
-
Close the feedback loop with cost reviews
- Every two weeks, review cost per request, per tenant, and per workflow. Compare to budgets. Use boundary telemetry to identify top cost contributors and decide on changes such as prompt refactoring, model downgrades, or caching.
-
Document and prove compliance
- Retention: Set retention windows for payload telemetry and enforce them in the in VPC store.
- Access: Use role based permissions that mirror your observability platform. Log access to sensitive payloads.
- Evidence: Export audit friendly reports that show who approved what and when, tied to boundary events.
Architecture notes and tradeoffs
No approach is magic. Here is what to watch when you adopt zero instrumentation observability for agents.
- Encrypted protocols and payload capture: Outbound Transport Layer Security hides content by design. Two options exist. One, use application level configuration to let the sensor parse request and response payloads for allowed domains. Two, rely on rich metadata, token counters from provider responses, and selective application hints. Both keep you inside the VPC and avoid default egress.
- gRPC and streaming: Many providers and tools use gRPC or server sent events. Ensure your sensor supports these transports with correct message reassembly and backpressure handling. Test at scale with long running streams so you do not miss tail events.
- High cardinality labels: Agent workflows can produce a flood of unique labels such as step names and tool identifiers. Use controlled vocabularies and sampling to keep your time series system healthy.
- Joining with OpenTelemetry: You probably already have distributed traces. The fastest win is to join eBPF boundary events with existing trace identifiers at ingress and egress. This gives you the best of both worlds with minimal code change.
- Redaction and summarization workflows: Not all prompts can be stored verbatim. Build pipelines that summarize sensitive payloads to allow search and triage without exposing regulated data. Make these rules explicit and test them.
The business case in one page
You are going to be asked why now and why this. Here is a concise case you can reuse.
- Faster time to production: You can bring pilot agent projects under the same operational standards as your services within a week. No major code rewrites.
- Lower total cost of ownership: You cut developer time spent instrumenting, reduce vendor data egress, and consolidate telemetry pipelines at the node. Dashboards are simpler and alerts are more reliable.
- Better risk posture: Keeping telemetry inside your cloud boundaries simplifies compliance reviews. Auditors care about where data lives and who can see it. This model answers both questions cleanly.
- Future proofing: Providers, clients, and frameworks change quickly. A boundary based approach is resilient to churn. You are less likely to be broken by an upstream upgrade.
If you want to see how other agent layers are consolidating control, our look at memory as the new control point shows how state management amplifies the value of solid telemetry.
Where this goes next
Expect standardization around a small set of boundary level signals for agents. Providers will expose more useful headers and response metadata. Sensors will get better at correlating multi process workflows while staying efficient. If the market follows patterns from networking and tracing, we will see open formats for agent telemetry and cleaner interfaces between kernel level capture and user space analytics.
Groundcover’s move marks an inflection point because it brings a mature technology to a new problem at the right time. eBPF has powered high scale observability before. Applying it to agents, with in VPC defaults and no required SDKs, makes reliability, auditability, and cost control something you get on day one rather than a project you hope to staff later.
For leaders shipping agentic features into production, this is also a cultural shift. When observability becomes a platform capability that requires no developer ceremony, teams move faster with fewer regressions. That is the same lesson we saw as agentic AI moves to daily ops. The tooling finally matches the ambition.
A clear conclusion
Agent systems stop feeling like research when operations is boring. Zero instrumentation observability inside your own cloud makes that possible. You get consistent coverage without code churn, audit trails without data egress, and budgets you can defend. Whether you run a single RAG service or a fleet of cooperating agents, start at the boundary. Let eBPF provide the common ground where development, operations, and compliance can all stand. The teams that do this now will ship useful agents sooner, fix them faster, and sleep better while they scale.
